Key Level + Reclaim + Foot Print = A+ Reversals
When it comes to finding a quality reversal after a sharp move up or down, there are hints / clues that can be left behind in what are called “Foot Print Charts.”
These kind of charts are not your traditional candle stick charts that measure price movements in a 2 dimensional fashion in terms of “time + price.”
Foot Print charts can provide a 3rd dimensional view of what is happening inside each price level by measuring the volume being transacted and in what fashion as price moves above or below key levels of interest.
This context helps provide some clarity as to who is doing the most “effort” or trading aggressively at these critical zones known as support / resistance / demand / supply.
When price is trading say at a supply / resistance a foot print chart gives us an x ray view of what is occurring under the hood and what behaviors are bulls / bears have or have not accomplished by viewing their “effort” in terms of buy or sell imbalances, absorption.
These terms, can help us understand if a reversal is imminent upon a “reclaim” of a level. If you are a fluid reader you understand Rick Trades Reversals. Reversals by their nature are fierce and strong moves that provide clean + high reward set ups.
Today we will discuss what information we can use in foot prints to better identify when a reversal is probable.
The simplest way to explain this entire concept will boing down to a lot of effort with no reward at a supply / demand / support / resistance zones.
Join me Trading Live on Youtube
Follow Me on X
$30.00 off Jigsaw Order Flow Software : Code TradewRick
Get Instantly Funded with Fast Track Trading 30% off Code: FTT_30
Apex Evaluation Accounts for 80-90% off Code: TradewRick
Intra Day Commentary on Discord trial
Foot Print Chart Example from 10/17/2024
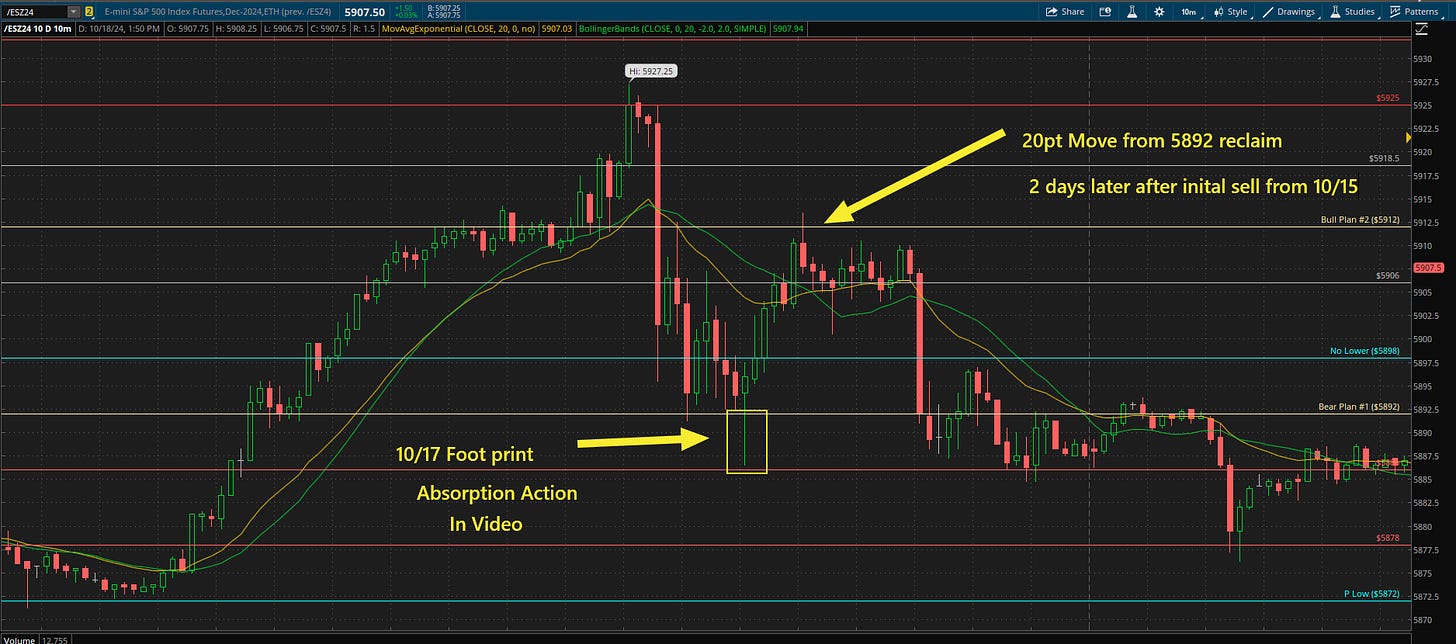
This trade resulted in a 20pt move on ES both ways and both will be discussed in today’s examples!
Above all else in order to have a meaningful reversal using this information that is worth the risk the PRICE LEVEL must be significant.
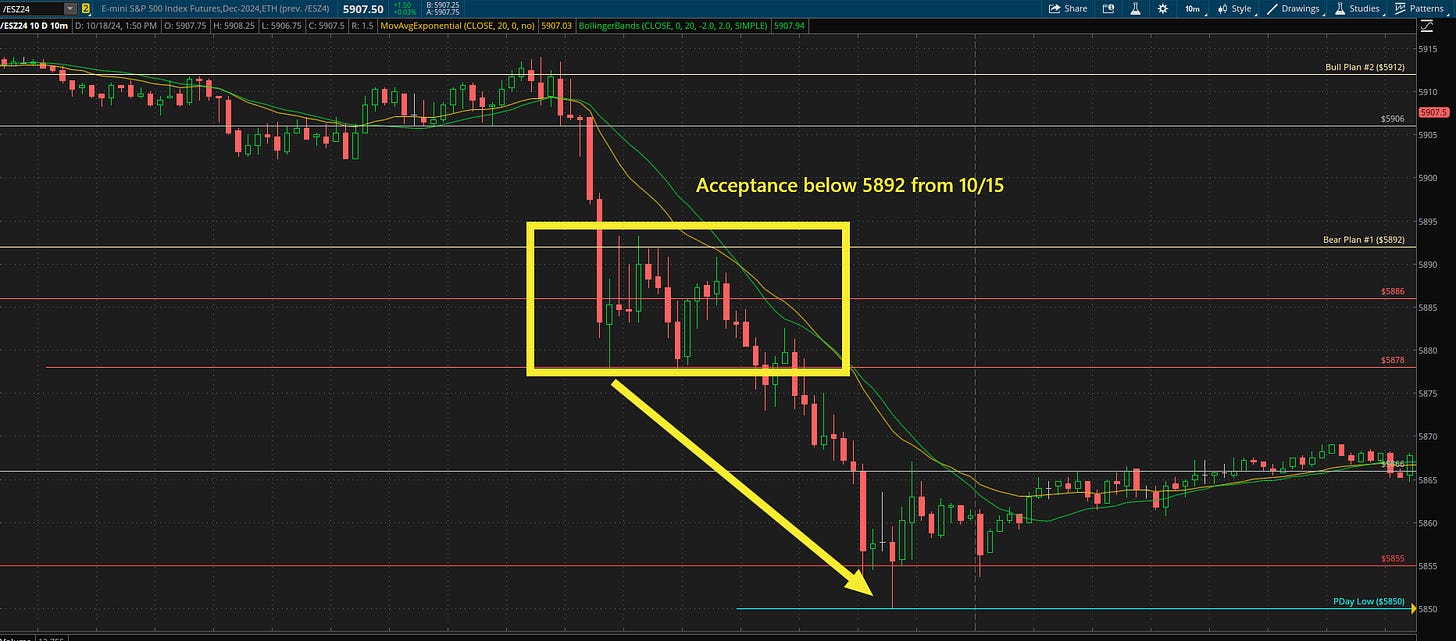
The 5892 was key to the sell side we had experienced on 10/15 which resulted in a 40 pt drop once "acceptance was form below it.
Attached is a photo of the action on 10/15 which clearly shows how relevant they the absorption in 5892 as important for the action in the video for 10/17 that resulted in a 20pt pop
Here is the candle stick chart of the action in the video from 10/17 where absorption occurred and what move it resulted in :
Now that the over view is explained, we can discuss the video and its context.
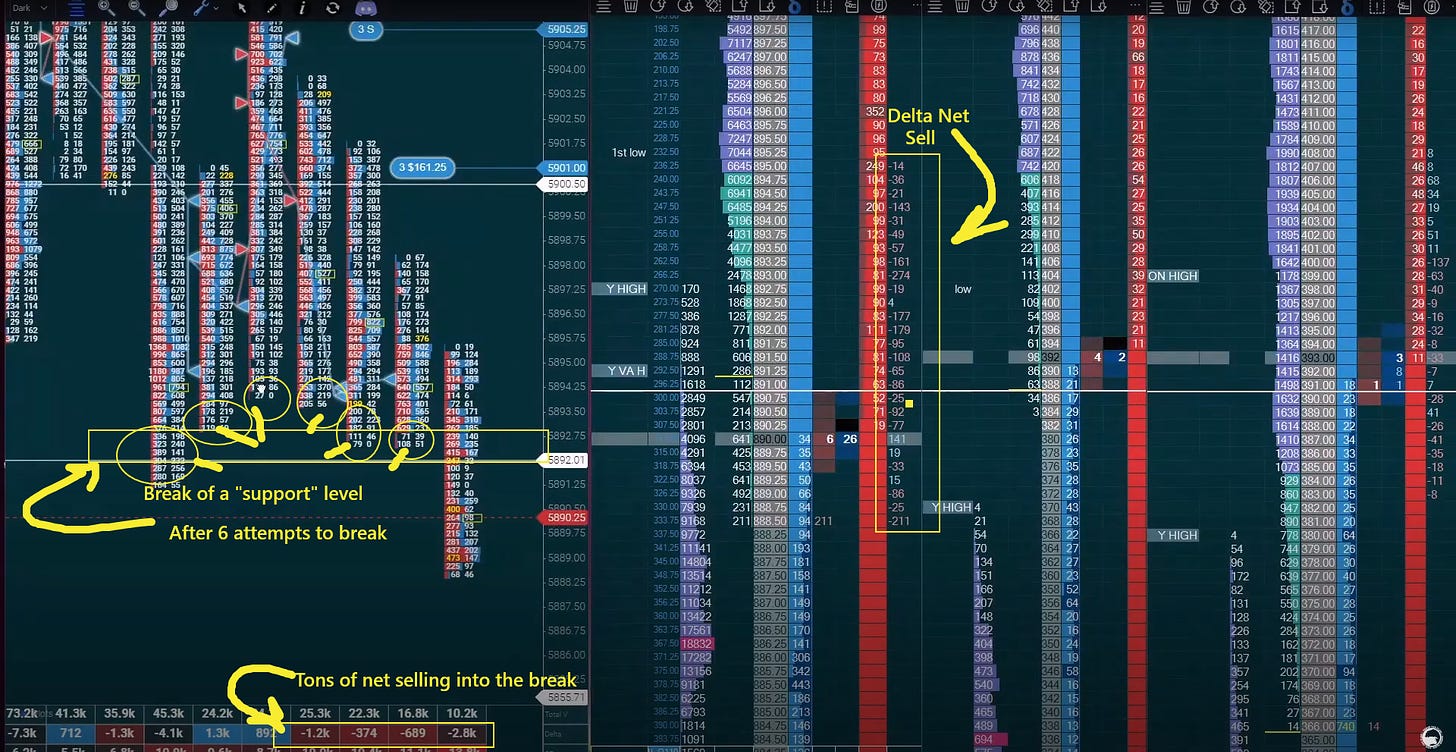
A flurry of Net Selling on DOM Delta print
break below the 5892 level with "thick"
profile of volume right underneath from 5891-5888
"yellow numbers" on FP indicating that there is imbalanced attempt at breaking that low
At the tail end of this drop near 5887-88 the "Delta Net Selling" on DOM increases to a peak 200+ over a series of 3-4 ticks (Very high amount of effort to break price )
This occurs at about 0:52 in the video
Right after this selling the Delta turns "Blue" indicating that there is active market buy orders that are unbalancing all the net selling into the peak effort
at about 2:00 Delta Foot print shows a peak of 2.9k contracts sold with no further downside
All of this indicates there is a lot of effort to sell and break below with no reward. Hence the trap can be set and the trigger is as always the "reclaim" of a key level as this indicates the battle of the bull bear has been claimed and a reversal to test the other side of the auction "resistance" is in play. On this day the support was 5892 and resistance was 5900'
Recap Image Below of Video:
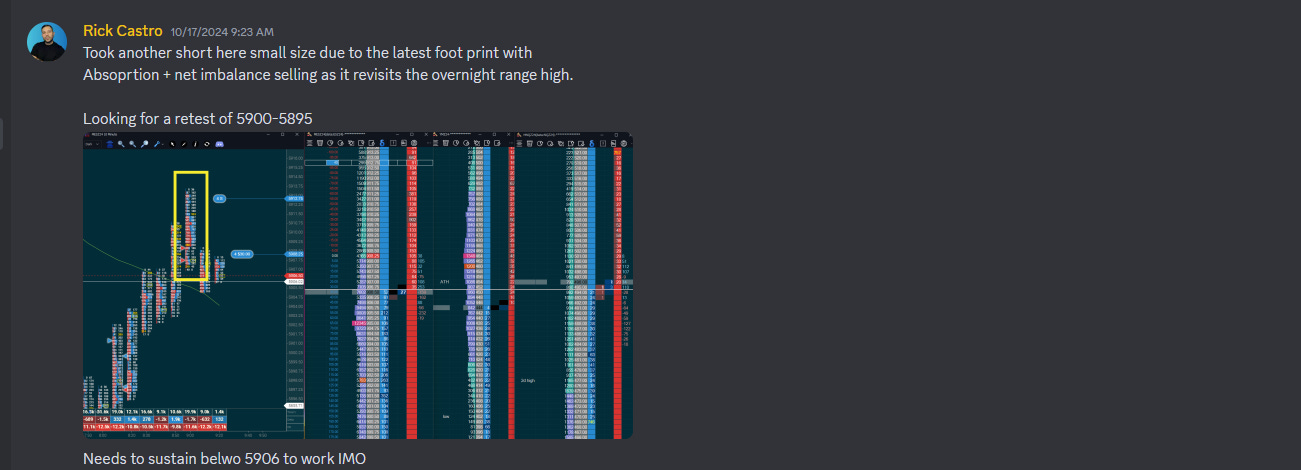
ES Foot Print Chart Example off 5612 Sell Reversal
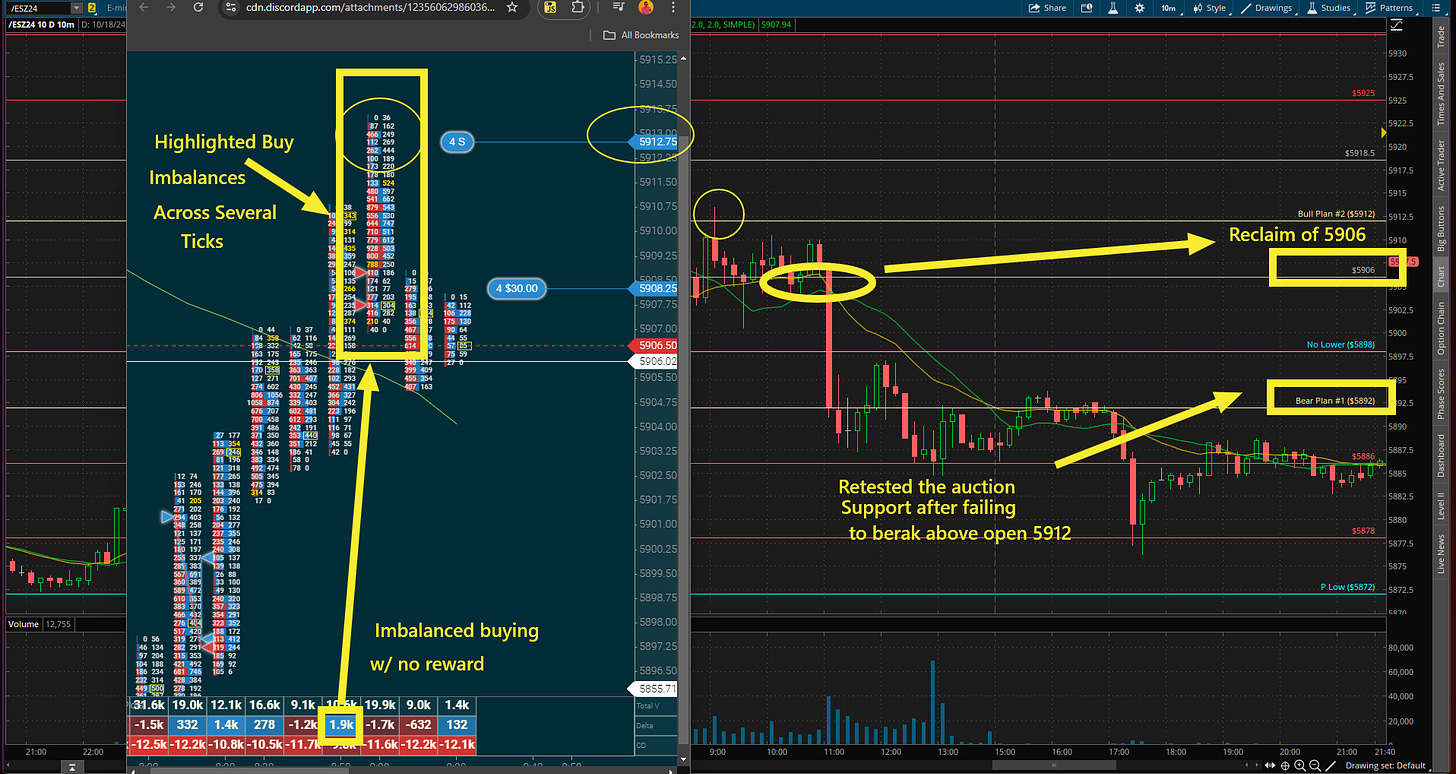
Attached is another example from the very same day 10/17 after the "max effort" no reward failed break above 5912. I unfortunately do not have a recording of this since it was off stream, I did put this trade idea in the chat the day of as well explaining what I saw and why it was worthy of a short. Same principles as the absorption at the break below of 5892 in the prior example.
Several imbalanced buying on the break above 5906 over several ticks
Thick profile with a thin tail end on the failed break above 5912 10/17 (Open range high)
1.9k Market buying over selling that resulted in no "reward" and net selling continued there after.
Live commentary on Discord for Sell Idea on 10/17 :


thanks for the FP video, need more of these ✅