


In our last post, we talked about the Failed Breakdown (FBD). The trap that catches bears and fuels explosive moves higher. But the question remained, How do you know which support levels will hold and which will fail?

PS - As you read this there will be a follow up post that further explains the in depth of how, what and where to find the gamma flip, walls. So make sure to sub to be notified.
Market Maker Hedging: The Structural Slingshot
Market makers (big banks and institutions) aren’t in the business of “betting” on direction. Their mandate is to remain Delta Neutral. When they sell you a call or a put option, they must immediately hedge their risk by buying or selling the underlying asset, such as ES futures.
Because they must remain neutral, their hedging activity often creates massive “walls” or “magnets” at specific price strikes. These concentrated zones are known as Gamma Levels. These gamma levels can be used for break out, break down, etc but for the sake of this post we will only discuss how they relate to Failed Break Downs.
Put Walls and the “Pin” Effect
When dealers sell large amounts of options, they have an operational necessity to manage those positions. As price reaches zones where SPX has high open interest specifically Put Walls in this example, market makers often become net buyers as prices fall. The caveat is we must be in a positive gamma regime. This regime dampens volatility and “cages” price. This mechanical hedging essentially forces the market to stay near that level, allowing the dealers to keep the options premium paid by options traders.
The 0DTE Factor
The explosion of 0DTE (Zero Days to Expiration) options has amplified this effect. Because gamma grows exponentially as expiration nears, market makers must hedge more aggressively in real-time, often turning these strikes into intraday magnets. These zones can shift daily or even hourly depending on volume due to volatility.
How To Trade the Gamma Levels
To identify a high-quality Failed Breakdown, ask yourself two questions:
Is the ES breaking a major Gamma Put Wall or Flip Zone? (A Gamma Flip marks where dealers switch from damping volatility to amplifying it).
Is there timeframe alignment? Does this gamma level align with a prior overnight, multi-hour, daily, or weekly low?
If the ES trades below these significant zones and then quickly reclaims them, you aren’t just trading a technical intra day patter, you are trading a structural reclaim where Market Makers are forced to buy, giving your trade massive wind at its back.
The Gamma Level From 1/16/2026
In Friday’s newsletter, I shared one specific level to lean on intraday: 6968.
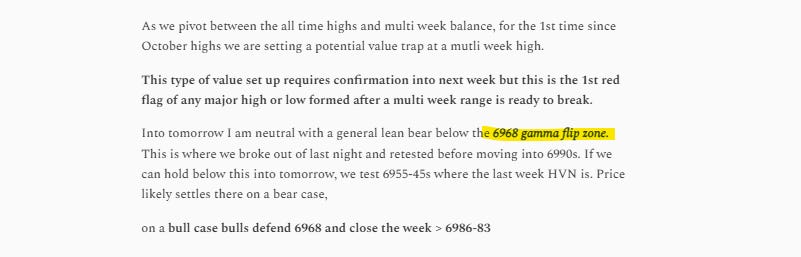
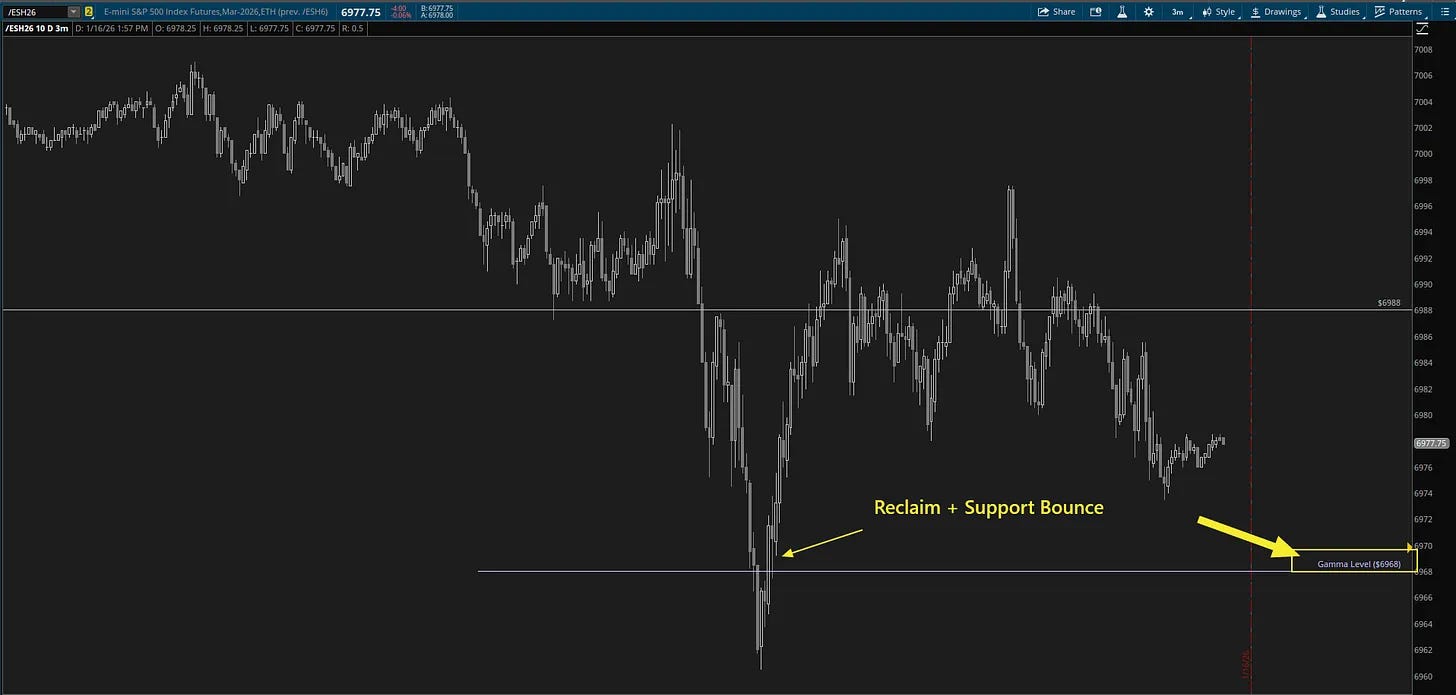
Looking at the set up above, the price action was a textbook “Look Below and Fail”:
The Probe: We broke below the 6968 Gamma Flip Zone to trap the late shorts.
The Reclaim: Price quickly popped back above, confirming that dealers were net long gamma and acting as a floor.
The Result: After a successful retest, the ES ripped, ultimately backtesting the NY Open breakdown level of 6988.

This seems so obvious, but despite my being familiar with both concepts, it didn't click in my head to connect the two together together. Thank you. It's also cool that you know how to use Python to pull your own option data and calculate your own gamma walls.
Thank you for this insight. Where do you get the levels from? As there are tons of services and each one calculates a bit different.