


When it comes to trading, whether intra day , swing or any time frame in between there are really only 3 ways to trade. You look for break out / down, trend continuation trades post break out or my personal favorite, reversals.
If you have been a consistent reader, first and foremost thank you! You should know by now, Rick Trades Reversals.
(Btw if you have been a consistent reader or even a paid reader please comment below, Rick Trades Reversals, I will comp anyone who comments 1 month free as a token of my gratitude.)
In this post we will be discussed the technical of what a reversal trade looks like on a chart specifically the ES / SPX / NQ charts, there are a multitude of time frames in which they occur, from daily, multi hourly to even as small as the 3 min time frame. The larger the time frame the larger the magnitude of the move.
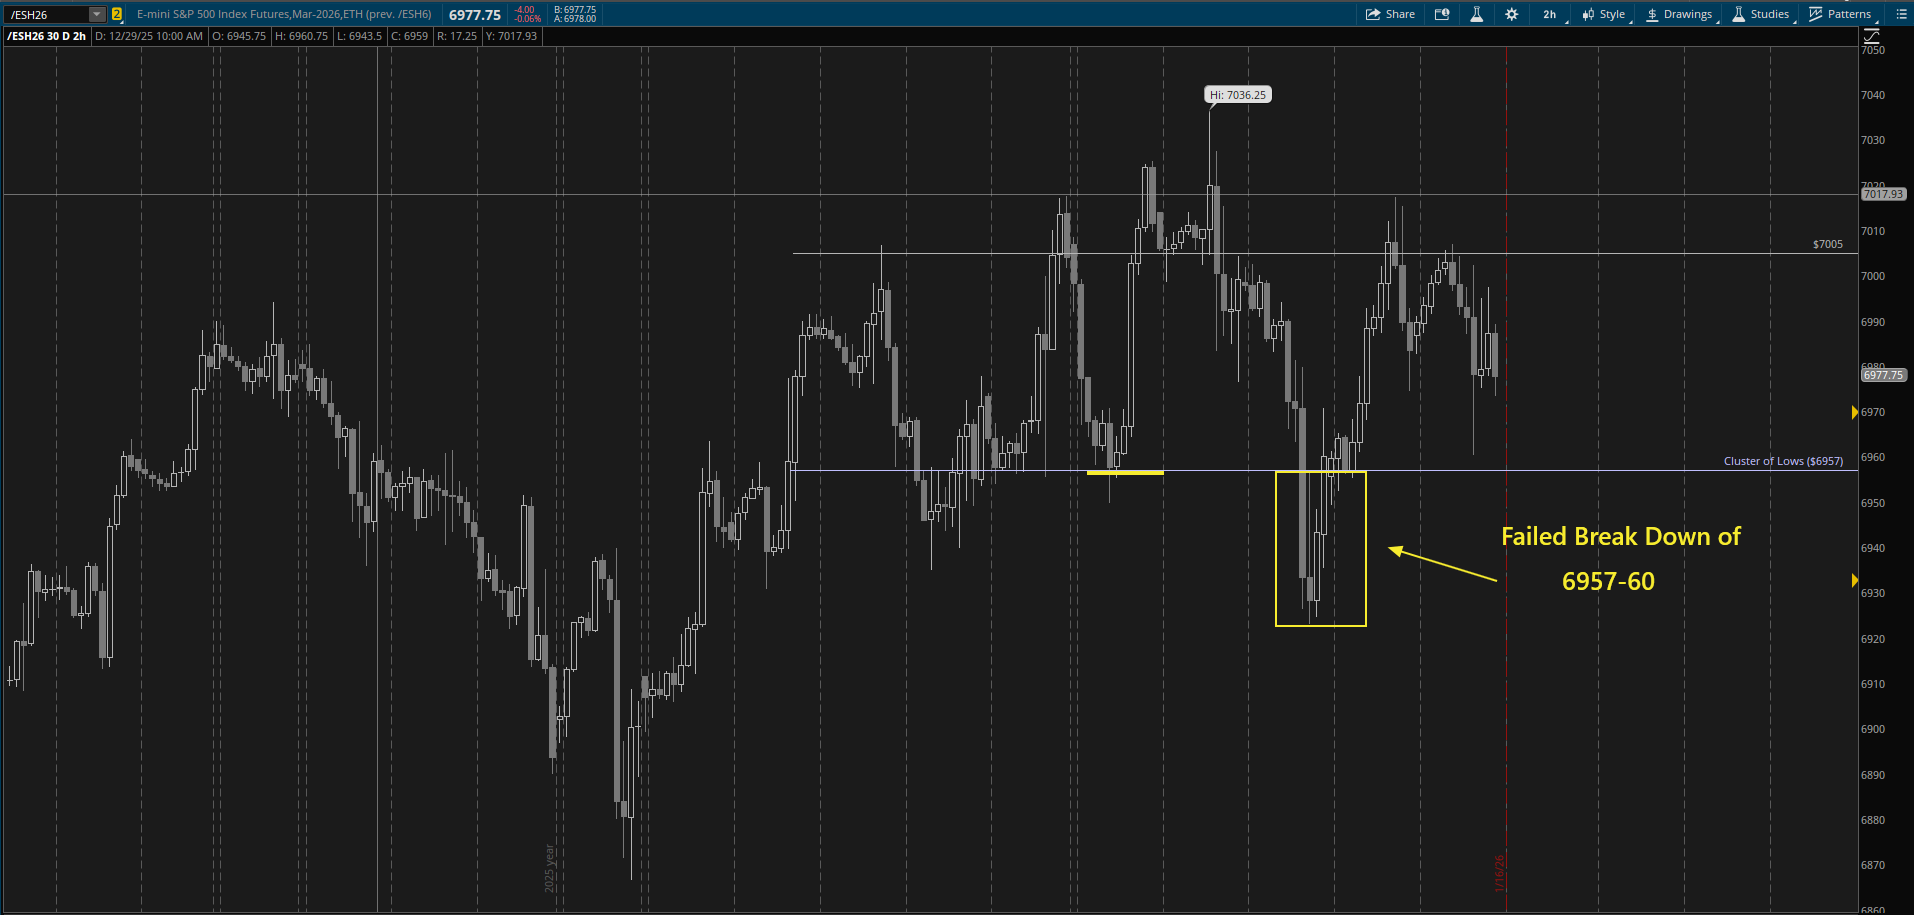
In the chart above (2HR), there is a multitude of failed break downs the most recent one was from 1/15/2026.
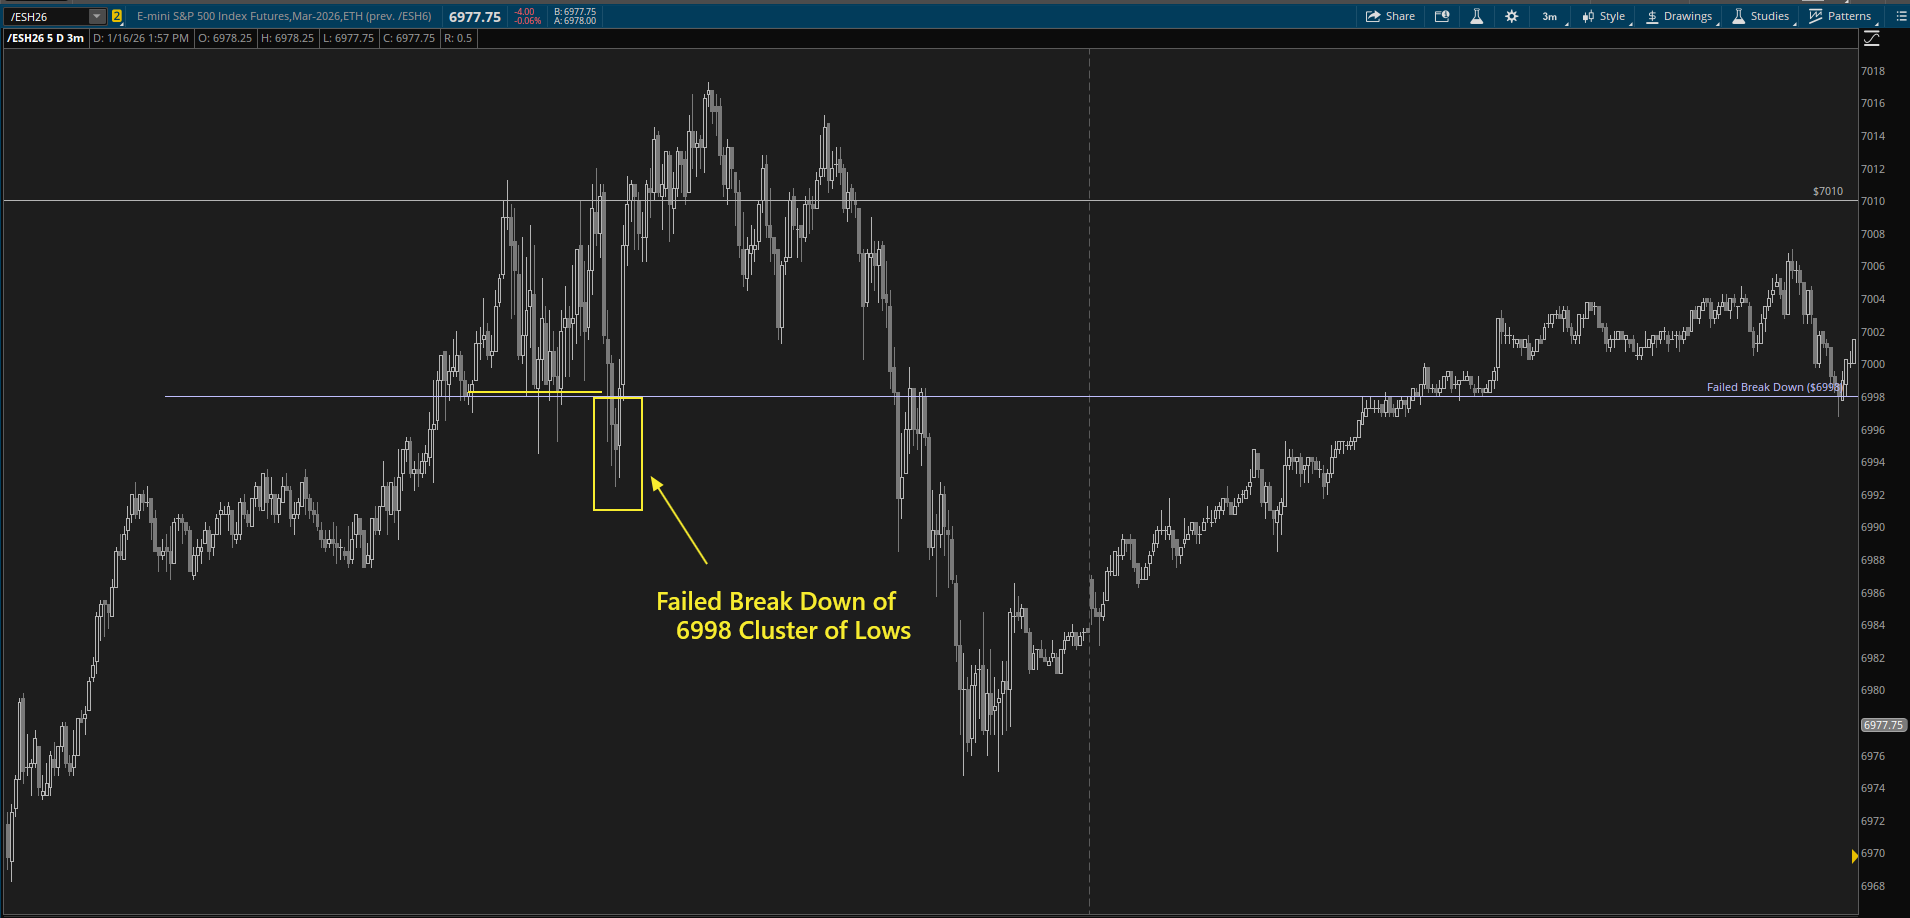
Another example in a smaller frame (3min). This trade was taken live on Youtube here. Set up was taken on 1/15/2026
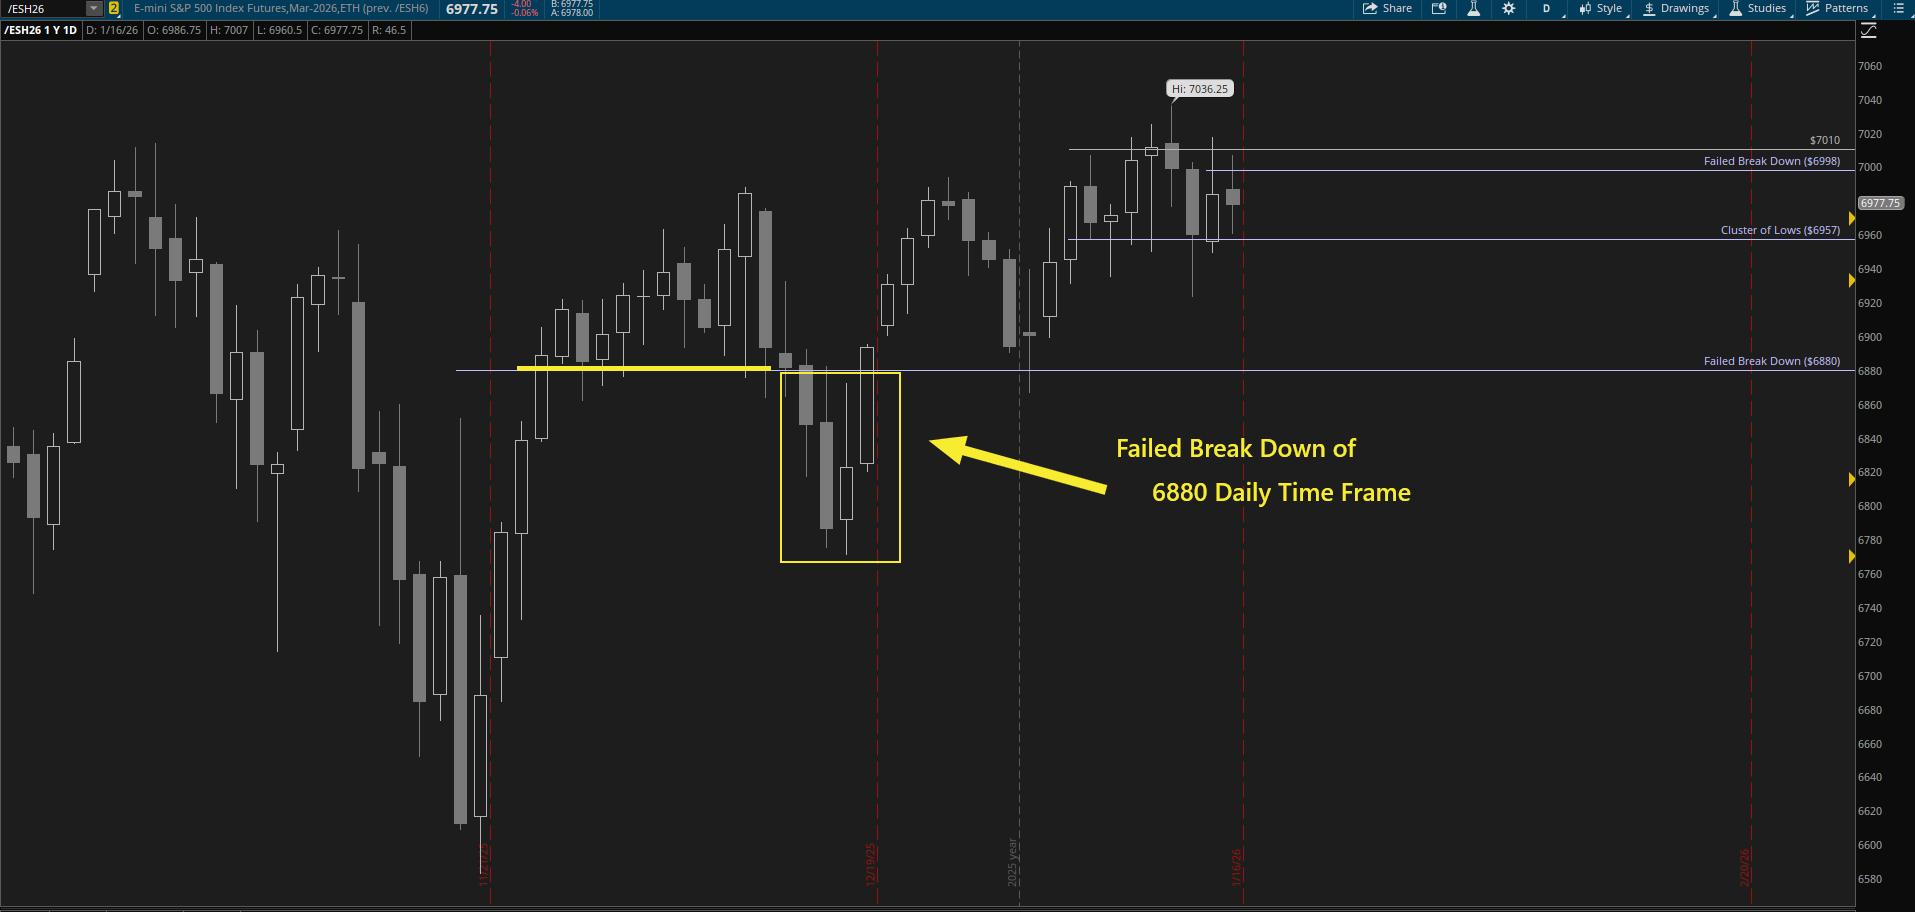
Yet another example of this set up in the Daily, this set up was discussed in this very newsletter below. This was covered on 1/6/2026

Rick Trades Reversals
Yes, Rick we get it you trade reversals. But WHY do you trade reversals and how can I identify them in real time?
The reason why I trade reversals #1, I am by nature contrarian, they come natural for me as an individual, this alone is why they make sense to me to spot enter and execute.
#2 from the images shared above you can clearly see the set ups are not short in abundance they are inherently a part of the assets characteristics so they occur rather frequent, they are all from the last 30 days or less. At the time of writing 1/17/2026
#3 the set ups provide clear invalidation points with clear target areas, there is no guesswork on where the invalidation is and where the targets are. This eliminates the guess work of proper stop loss placement + targets. Leaving me with only one job, wait.. chill … relax.. find the failed move lower, enter let the rest do its thing.
How to Identify Zones Of Potential Entry
First we must identify a quality zone of support, ideally has tested 2x min and bounced, that has previously netted a move of at min ~10+ pts this is going to vary as you identify them at different time frames, but 10 is the sweet spot for me.
(There is a way to fine high quality levels of interest using Market Maker positioning which I will be posting as a part 2 of this post so make sure you subscribe to be notified of the next post that drops!)
Part 2 live in this post so check it out after your read!

Second, now that we have identified the support zone, price must dip below the initial support zone how much will vary from time frame to time frame, the only thing that matters is allow price to return higher, no guess work if it will you return, we must respect price at all costs and allow it to show its hand.
Third, allow price to come back in and put in a close > the support zone, the time frame of the close will vary on the frame you are trading, if its 3min then allow a 3 min close if its daily then allow a full session to close into the last hour, if its multi hour then give it room to close an hour or 2 before executing. This gives us real time market data that price has accepted the prior support and is ready gearing up to squeeze.
Finally, once executed we respect the structure and place stop below the low end of the structure and target the prior resistance form the 2 prior bounces, personally I like to leave runner in case this turns into a break out to trend continuation trade.
TLDR;
The Level: A clear daily or hourly support line.
The Look Below: Price dips below the level (this is where the “breakdown” looks real).
The Reclaim: Price closes back above the level on a lower timeframe (time frame relative)
The Entry: Long as price reclaims prior support
The Stop: Just below the low of the “failed” move.
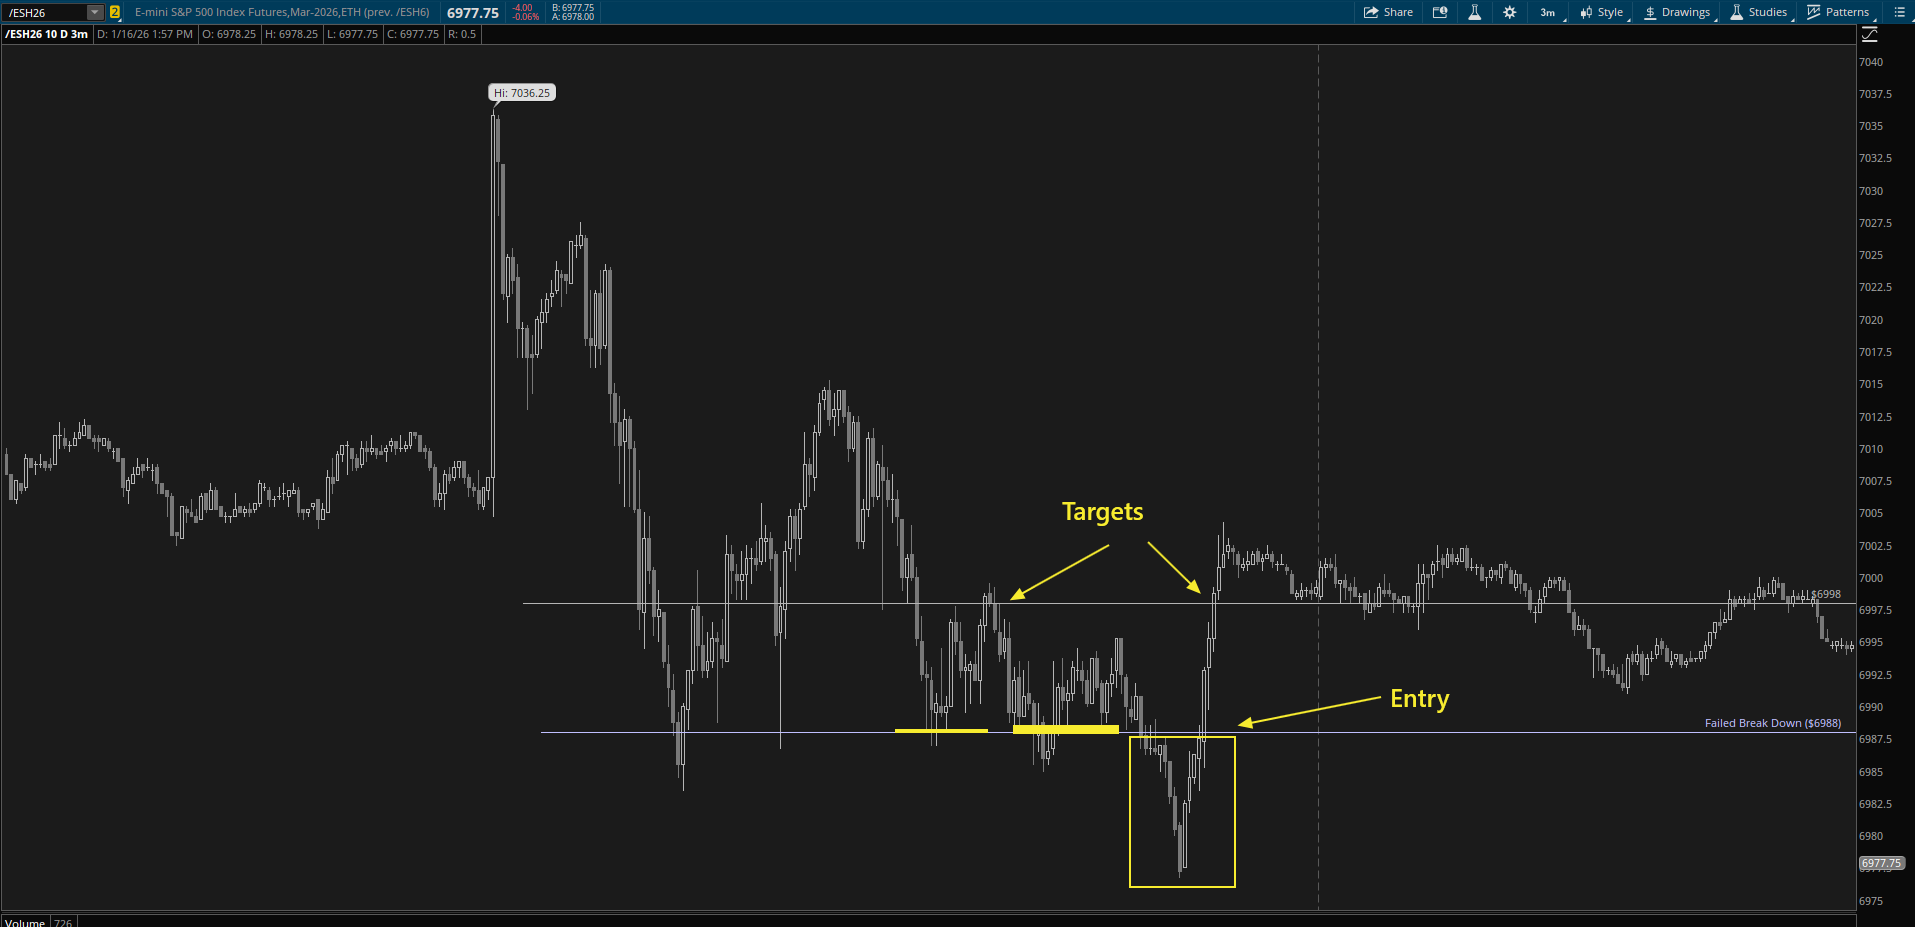
Mechanics of Failed Break Downs
Now if you have a bit of tism’ and need an explanation of why these set ups work under the hood, I will use the best of my understanding of market mechanics on why this happens. Truly, at the end of the day there isn’t a blueprint as to why these work since markets have so many fundamental layers to them it would be crazy for me to tell you this is why x does y, end of story. One I am not that smart and two markets are highly complex so I doubt there is one simple answer.
Because markets are multi faceted there are always participants, selling, buying and for a Market Makers sake, attempting to remain neutral to link these bids and offers. Due to this there are clear participants who short levels on the break down of a support who trade based on break out / down setups and then those late chasers who short the hole hoping they caught the next big dip.
You layer this with a gamma flip level (High quality zone) and you get a trifecta of 3 different participants, the tactical short trader (break down), the fomo trader (chaser) and the institutional trader (neutral party) who all become net short and for every net short individual they all have invalidation points, the reclaim, once those trigger they become, buyers. Those bids coupled with fresh money buyers, actual bulls accelerate the move higher which is a self reinforcing move higher resulting in the strong moves up after a failed break down.
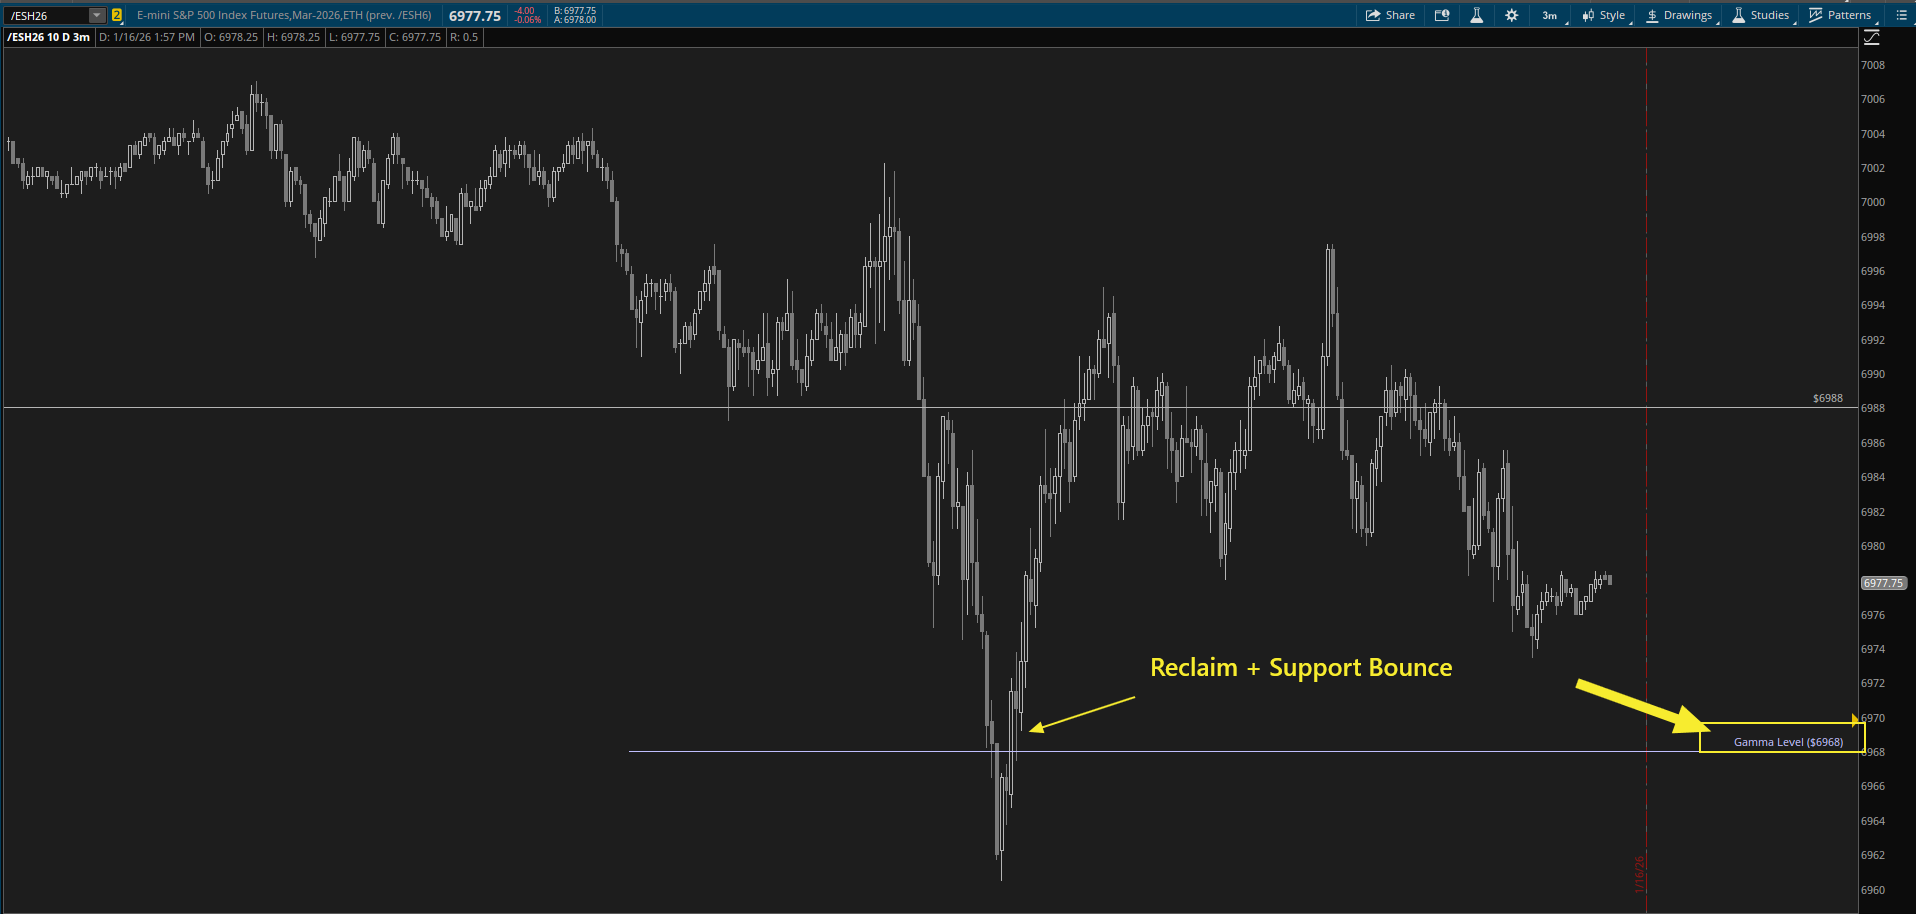
To show the power of Gamma levels above is the gamma level shared on the pre market plan post for 1/16/2026 Friday trading session, 6968!


Thank you for all that you do!
I like the 3 minute. There's a good reversal above the low and below the high from the overnight. In a failure in the other direction makes the great reversal. Thanks for your work Rick.